
Overview
An in depth look at previous work and proposal for next steps
Study 1
2018-2020
Introduction
Bees are important pollinators and without them our ecosystem would collapse. Colony Collapse Disorder is the umbrella term given to the factors that are currently killing bee populations. These factors include harmful pesticide use, habitat destruction, and deadly mites. In an effort to help regrow the honey bee population, urban beekeeping has become increasingly popular. Bees typically travel up to 2 miles from their hives and come into contact with more than just the flowers they pollinate. They pick up various bacteria along with other microorganisms which they bring back to their hives, later incorporating them into the honey. [1]
The microorganisms are dormant in honey, allowing DNA to later be extracted and sequenced. [2] What was unknown going into this experiment was if the samples from the city would have drastically different or reduced diversity in microbes, compared to those from outside the urban environment. The samples were also compared to store bought honey to see if that changed the types of microbes found. In New York City, the bees are influenced by different conditions than those with lots of open space to forage. Lacking the information about what bees are coming into contact with, my research question became the following:
Research Question
Are the microbiomes of honey samples from various neighborhoods in New York City different, and if so, how do they compare to each other and reflect the different locations? Are samples bought at a store or a hive different from honey that has been created from bees who have more dedicated space to forage?
Hypothesis
Our hypothesis was that there would be a discernible difference between the microbiomes of the samples that would reflect the respective landscapes and areas, specifically when comparing the city samples to those closer to nature. Looking at the species in the microbiomes, the samples from within the city should differ from rural samples as they are exposed to a different set of conditions and environments. In comparing the samples from different areas within the city, they should have more similarities than differences, but still unique.
Methods
We worked with a New York City beekeeper to collect samples from various locations (mostly rooftops) around New York City as well as one from Westchester County. For a final comparison, we bought a container of honey from Trader Joe’s that came from a farm in Pennsylvania. The New York locations were: 86 4th Ave, the Financial District, Madison and 44th Street, Harlem, Rockaway Beach, and Forest Hills. We then worked with Cold Spring Harbor Laboratory to do the procedures from the DNeasy Blood and Tissue kit, as well as the DNeasy PowerSoil kit. The reason that two kits were used was to see if the cheaper Blood and Tissue kit would extract the DNA from the viscous honey as successfully as the more expensive PowerSoil Kit. Using the PowerSoil kit also allowed us to look at both the gram-positive and gram-negative bacteria, providing a more in depth look into the biodiversity in the honey than just the gram-positive bacteria.
Once the DNA was extracted, primers, which bind to the DNA template and signals for it that fragment’s replication, were added. The samples were then placed in a thermocyclers to undergo Polymerase Chain Reaction (PCR), where the DNA is copied millions of times so that it can be visually seen in gel electrophoresis and in a large enough quantity to be sequenced. The samples were then placed in an agar gel and electric current passes through it. The gel electrophoresis illustrates banding after approximately 40 minutes. After this point, bands appeared on the gel, proving the DNA was successfully extracted and amplified. More importantly, the banding suggests DNA was collected. To fully determine the exact type of DNA, the samples were sent to a company called Genewiz. This company specifically sequences the DNA for examination. We then reviewed the DNA using a program called DNA Subway to determine the genus and species of each DNA found in the honey.
Results
We worked with company CosmosID to create krona graphs from the metabarcoded sequences that I received from Genewiz. All of the samples had a distinct pattern in the krona graph and all of them were very diverse in the DNA found. Throughout all of the samples and across the two methods, 278 unique DNA sequences were found. Using the Blood and Tissue kit the following bacteria were found in all of the samples tested: actinobacteria, Methylobacterium, firmicutes, Streptococcaceae gordonii, Lactobacillus, and cyanobacteria (see figure 1). Among all of the samples tested using the PowerSoil Kit, Pseudomonas and Staphylococcus epidermidis were found (see figure 2a).
While the results showed that many of the samples had the same bacteria, they all had different rates of abundance and had bacteria that were unique to their locations. For example when using the Blood and Tissue kit, there were very few bacteria that the 44th and Madison sample had in common with the Westchester County sample. The ones they had in common above a 1.00% abundance were Enterococcus sulfureus and Corynebacterium. These locations are very different from each other, with one being in the heart of Manhattan, while the other is a large farm. [1] One outlier found was that of the DNA sequenced from the 86 4th Ave sample, 11.38% of it was cyanobacteria. This is compared to the other samples that only had 1.35% to 3.5% rate of abundance (see figure 2b)

Figure 1: Taxonomic Diversity of the microbes found.
Legend:
2G = 86 4th Ave. - Soil Kit
2H = Harlem - Soil Kit
2P = Store Bought / Pennsylvania - Soil Kit
2Q = Forest Hills, Queens - Soil Kit,
2W = Westchester County - Soil Kit
F0 = Financial District - Blood and Tissue Kit
G0 = 86 4th Ave. - Blood and Tissue Kit
H0 = Harlem - Blood and Tissue Kit
M0 = Madison and 44th - Blood and Tissue Kit
P0 = Store Bought / Pennsylvania - Blood and Tissue Kit
W0 = Westchester County - Blood and Tissue Kit.
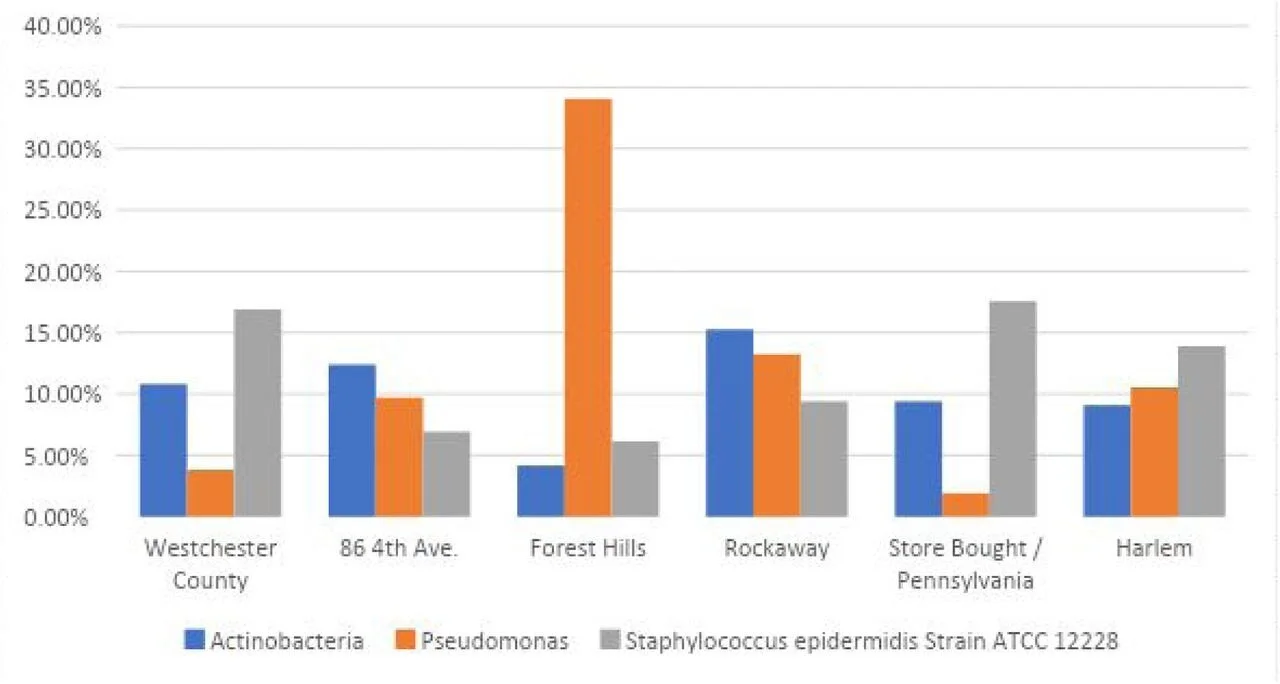
Figure 2a: Percentages of selected microbes identified using the PowerSoil Kit (gram-negative and gram-positive bacteria)

Figure 2b: Percentages of selected microbes identified using the Blood and Tissue Kit (gram-positive bacteria)
Discussion
Resulting krona graphs show patterns in line with exploratory hypotheses. While common microbe types were found, there were present in each sample in varying proportions. The data provided information about the location and potential hazards to bees, such as the cyanobacteria, which can produce cyanotoxins that are harmful to humans and increase the mortality rate of bees by reducing their ability to learn odors.[3] The bees and by extension their honey, are able to serve as bioindicators about the surroundings of the hives and gathering a diverse population of bacteria.
The city samples were not lacking in microorganisms compared to the Westchester County sample, but there were differences between what was found in relation to the varying locations. The store-bought sample also had various bacteria present compared to the samples taken straight from the hive. Honey expresses individual characteristics of New York City nature and exhibits information on a microbial level. The results found here were consistent with other studies about the general microbes found in honey, namely the presence of Firmicutes, gammaproteobacteria, and actinobacteria [4]. However, the previous study did not use honey from New York in particular-- which may be diverse in comparison-- and rather looked at the relationship between the bees’ gut microbiome and age. Thus, predictions in relation to our samples were unspecified pre-testing. To expand these findings, we know turn to investigate more diverse samples from a range of geographical profiles to explore trends in the diverse DNA microbiomes of honey.
Study 2
2020-Present
Introduction
Honey can be categorized and labeled a number of different ways. “Raw”, which means that it is unpasteurized (not heated above 118°F). “Unfiltered” honey can contain small pieces of honeycomb and pollen. Lastly, the label “organic” honey means that there must be a 2-mile radius around the hive where the plants are certified organically grown, meaning that they do not use pesticides. [5] Previous studies have used bees as bioindicators about their environment, by looking at pollutants, [6] rare earth metals, [7] and pesticide evidence [8] that the bees have picked up and brought into their hives. This information however is hard to specify, because we are unable to know exactly where bees are traveling other than that their movements are approximately within a 2 mile radius of the hive.
“Colony collapse disorder” refers generally to causes of bee population decline. This includes the introduction of microbes that are harmful to honey bees: Paenibacillus larvae, Melissococcus plutonius, Spiroplasma apis and Spiroplasma melliferum [9]. Another cause of the hive destruction is the Varroa mites that infect and kill the bees [10]. This leads to “drifting”-- a phenomena where infected bees migrate to foreign hives, are accepted by the new bees, and spread the destructive disease as they are more likely to be accepted by the new bees than those from their own former hive [11].
Pesticides can cause viruses in bees and suppress the bee’s immune system [12]. They may be helpful or harmful to the microbes depending on type, causing an imbalance in the biome [13]. Because bees are inherently social, many of their interactions can lead to pesticide exposure (see figure 3) [11]. In an effort to avoid the disastrous consequences of pesticides on bee health, farmers have begun using biopesticides to protect their crops. There are three main types: microbial pesticides, biochemical pesticides and plant-incorporated protectants [14]. While many are considered non toxic to bees, azadirachtin and spinosad caused the larvae to become deformed due to it affecting the growth regulator properties in the bees [15].
While the detrimental effects of pesticide use on bees is established [13], little is known of the effects of long term biopesticides use. Neonicotinoids, a class of insecticides, act like nicotine to bees and they become addicted to is as it kills them [16]. Unfortunately it is still used across the country [17] and when compared to a map of the bee’s decline (see figure 4), it suggests just how detrimental these pesticides may be to the hive populations [18]. When neonicotinoids were introduced to crops in the UK, Hungary, and Germany, they found that the hives were 24% smaller the following year, there were fewer queens, and solitary bees laid less eggs [19]. Due to the clearly harmful effects, neonicotinoids have been mostly banned in the EU [20] and Canada [21]. Unfortunately, there are no longer any real rules against their use in the United States [22]. It is unknown how these different regulations may affect bees, hive health, and honey in their respective countries.
There is a common misconception that the GMO plants are destructive to the bee populations. However, it is actually the herbicides that are commonly paired with them that hurt the bees [23]. It is possible that the contents of the honey is different, depending on if the bees came into contact with GMOs though tracing the connection is challenging due to the prevalence of genetically modified crops.
![Figure 3: Ways that bees come into contact with pesticides and the respective effects. [14] ](https://images.squarespace-cdn.com/content/v1/5f6d02d8fc4b932fe2c869db/1604282859585-HNFN5FP8PBKQRXT4OTMY/Screen+Shot+2020-09-23+at+5.18.50+PM.png)
Figure 3: Ways that bees come into contact with pesticides and the respective effects. [14]

Figure 4a: A map of Thiamethoxan (a neonicotinoid) use in the United States. [17]
![Figure 4b: A map showing the decline of bee populations [18]](https://images.squarespace-cdn.com/content/v1/5f6d02d8fc4b932fe2c869db/1604282941295-ZF9AMASR7FEEUJ5DVF96/BeeMap-2-web.jpg)
Figure 4b: A map showing the decline of bee populations [18]
Proposed Research Question
Building upon findings in the first study, here we ask: Is there a correlation between the microbes found in the honey and the country's regulations on pesticides and biopesticides? We also hope to explore how the microbes of certified organic honey compared to honey that is not considered organic and if there is any evidence of biopesticides found. To do this, we will characterize the individual ecosystems and their flora of the locations where our current samples are sourced to investigate potential variations in microbiomes. Specifically, we aim to explore how microbiomes vary in relation to the location’s native flora, proximity to industrialization, and the region’s usage of different biopesticides. For more information, refer to Table 1 in Methods.
Methods
We will analyze and compare the DNA of samples: from California, Colorado, New York, Illinois, Spain, Greece, Hungry, New Zealand, the Amazon Rainforest, and Kenya. Additionally, we have a flight of honey samples from Trader Joe’s with containers from the United States, Mexico, Canada, Argentina, Brazil, and Ukraine. The information we have on the samples is limited, however we are able to determine if they are organic, raw, or unfiltered, based on the label in accordance with the production region’s standards. We have also grouped the samples by environment and geographic locations to compare them. We sought to collect diverse geographical and international samples with varying regulations on pesticides and biopesticide use.
To extract DNA, we will use the DNeasy PowerSoil Pro Kit to extract the DNA and use PCR to amplify it. We will then send it for sequencing at Genewiz. Resulting DNA sequences will be run through a large database (http://ir4app.rutgers.edu/biopestPub/labelDb.aspx) to determine what, or if, the associated microbes found are indicative of a specific biopesticide use.

Table 1:
List of the samples with their labeled types and the toxin that is most commonly used in that area for pest management.
For Type, O indicates organic, U is unfiltered, and R is raw. Here we categorize whether herbicides (H), pesticides (P), and/or biopesticides (B) are used in the region within proximity to our samples.
Works Cited:
[1] Weiss, T., Mayle, A. and Nash, B., 2020. The microbes found in the honey of New York City beehives. https://doi.org/10.1101/2020.04.16.042762
[2] Olaitan, P. B., Adeleke, O. E., & Ola, I. O. (2007). Honey: a reservoir for microorganisms and an inhibitory agent for microbes. African health sciences, 7(3), 159–165. https://doi.org/10.5555/afhs.2007.7.3.159
[3] Okle O, Rath L, Galizia C, Dietrich D. The cyanobacterial neurotoxin beta-N-methylamino-l-alanine (BMAA) induces neuronal and behavioral changes in honeybees. Toxicology and Applied Pharmacology. 2013;270(1):9–15.
[4] Hroncova, Z., Havlik, J., Killer, J., Doskocil, I., Tyl, J., & Kamler, M. et al. (2015). Variation in Honey Bee Gut Microbial Diversity Affected by Ontogenetic Stage, Age and Geographic Location. PLOS ONE, 10(3), e0118707. doi: 10.1371/journal.pone.0118707
[5] Grad, P. (2020). Raw vs. Pure vs. Organic vs. Unfiltered - How to Read Honey Labels. Retrieved 31 October 2020, from https://bigislandbees.com/blogs/bee-blog/raw-vs-pure-vs-organic-vs-unfiltered-how-to-read-honey-labels#:~:text=If%20you%20have%20the%20choice,miticides%20to%20treat%20the%20bees.
[6] Chiesa, L., Labella, G., Giorgi, A., Panseri, S., Pavlovic, R., Bonacci, S., & Arioli, F. (2016). The occurrence of pesticides and persistent organic pollutants in Italian organic honeys from different productive areas in relation to potential environmental pollution. Chemosphere, 154, 482-490. doi: 10.1016/j.chemosphere.2016.04.004
[7] Squadrone, S., Brizio, P., Stella, C., Pederiva, S., Brusa, F., & Mogliotti, P. et al. (2020). Trace and rare earth elements in monofloral and multifloral honeys from Northwestern Italy; A first attempt of characterization by a multi-elemental profile. Journal Of Trace Elements In Medicine And Biology, 61, 126556. doi: 10.1016/j.jtemb.2020.126556
[8] Malhat, F., Haggag, M., Loutfy, N., Osman, M., & Ahmed, M. (2015). Residues of organochlorine and synthetic pyrethroid pesticides in honey, an indicator of ambient environment, a pilot study. Chemosphere, 120, 457-461. doi: 10.1016/j.chemosphere.2014.08.032
[9] Voulgari-Kokota, A., McFrederick, Q., Steffan-Dewenter, I., & Keller, A. (2019). Drivers, Diversity, and Functions of the Solitary-Bee Microbiota. Trends In Microbiology, 27(12), 1034-1044. doi: 10.1016/j.tim.2019.07.011
[10] Evans, J., & Schwarz, R. (2011). Bees brought to their knees: microbes affecting honey bee health. Trends In Microbiology, 19(12), 614-620. doi: 10.1016/j.tim.2011.09.003
[11] Harwood, G., & Dolezal, A. (2020). Pesticide–Virus Interactions in Honey Bees: Challenges and Opportunities for Understanding Drivers of Bee Declines. Retrieved 31 October 2020, from http://publish.illinois.edu/dolezalbeelab/files/2020/05/Harwood-and-Dolezal-2020.pdf
[12] Brandt, A., Hohnheiser, B., Sgolastra, F. et al. Immunosuppression response to the neonicotinoid insecticide thiacloprid in females and males of the red mason bee Osmia bicornis L.. Sci Rep 10, 4670 (2020). https://doi.org/10.1038/s41598-020-61445-w
[13] Staley, Z. R., Harwood, V. J., & Rohr, J. R. (2015). A synthesis of the effects of pesticides on microbial persistence in aquatic ecosystems. Critical reviews in toxicology, 45(10), 813–836. https://doi.org/10.3109/10408444.2015.1065471
[14] Thakur, N., Kaur, S., Tomar, P., Thakur, S., & Yadav, A. (2020). Microbial biopesticides: Current status and advancement for sustainable agriculture and environment. New And Future Developments In Microbial Biotechnology And Bioengineering, 243-282. doi: 10.1016/b978-0-12-820526-6.00016-6
[15] Barbosa, W. F., Tomé, H. V., Bernardes, R. C., Siqueira, M. A., Smagghe, G., & Guedes, R. N. (2015). Biopesticide-induced behavioral and morphological alterations in the stingless bee Melipona quadrifasciata. Environmental toxicology and chemistry, 34(9), 2149–2158.
[16] Sgolastra, F., Medrzycki, P., Bortolotti, L., Maini, S., Porrini, C., Simon-Delso, N., & Bosch, J. (2020). Bees and pesticide regulation: Lessons from the neonicotinoid experience. Biological Conservation, 241, 108356. doi: 10.1016/j.biocon.2019.108356
[17] 2017 Pesticide Use Maps -. (2020). Retrieved 31 October 2020, from https://water.usgs.gov/nawqa/pnsp/usage/maps/show_map.php?year=2017&map=THIAMETHOXAM&hilo=L
[18] Wild Bee Decline Threatens U.S. Crop Production. (2020). Retrieved 31 October 2020, from https://www.uvm.edu/uvmnews/news/wild-bee-decline-threatens-us-crop-production-0
[19] Woodcock, B., Bullock, J., Shore, R., Heard, M., Pereira, M., Redhead, J., Ridding, L., Dean, H., Sleep, D., Henrys, P., Peyton, J., Hulmes, S., Hulmes, L., Sárospataki, M., Saure, C., Edwards, M., Genersch, E., Knäbe, S. and Pywell, R., 2017. Country-specific effects of neonicotinoid pesticides on honey bees and wild bees. Science, 356(6345), pp.1393-1395.
[20] McDonald-Gibson, C., 2013. 'Victory For Bees' As European Union Bans Neonicotinoid Pesticides. [online] The Independent. Available at: <https://www.independent.co.uk/environment/nature/victory-bees-european-union-bans-neonicotinoid-pesticides-blamed-destroying-bee-population-8595408.html?> [Accessed 31 October 2020].
[21] Johnson, L. (2016). Bee-killing pesticides banned in Vancouver | CBC News. Retrieved 31 October 2020, from https://www.cbc.ca/news/canada/british-columbia/vancouver-bans-neonicotinoids-1.3675572
[22] Trump administration lifts ban on pesticides linked to declining bee numbers. (2018). Retrieved 31 October 2020, from https://www.theguardian.com/environment/2018/aug/04/trump-administration-lifts-ban-on-pesticides-linked-to-declining-bee-numbers
[23] New study shows honeybees harmed by herbicide used on GMO crops. (2014). Retrieved 31 October 2020, from https://www.gmwatch.org/en/news/archive/2014/15710-new-study-shows-honeybees-harmed-by-herbicide-used-on-gmo-crops